The Signal That Won't Stay Still: SBP Drift in Chronic BCI Recordings
Part 1 of 3. I establish the drift problem here. Part 2 covers the fix. Part 3 introduces the nonlinear cross-session decoder.
Think about what it means for a brain-computer interface to actually work. Not in a lab demo. In someone's life.
A person with ALS gets a Utah array implanted. A decoder is calibrated — it learns to map the neural firing patterns in their motor cortex to the intended movement. On day one, it works. On day thirty, it might not. Not because the person's intention changed. Not because the task changed. Because the signal changed.
This is the SBP drift problem, and it bothers me enough to write about it.
Spiking-band power (SBP) is one of the most practical neural features we have for decoding movement intent from chronic implants. It's stable enough to compute reliably, informative enough to decode from, and it doesn't require spike-sorting. But "stable enough to compute" is not the same as "stable across days." The electrode tips oxidize. The tissue around them responds. Channels gain-shift. The population amplitude structure — the fingerprint of the array — slowly reorganizes over weeks and months.
A static decoder doesn't know any of this. It just knows what it learned on day one.
The Data I'm Working With
I'm using the LINK dataset from the DANDI Archive (accession 001201), distributed in NWB format. It's chronic Utah-array recordings from a non-human primate doing a finger-flexion task. Each session gives me precomputed SBP at 20 ms bins across 96 channels, plus the corresponding finger-velocity traces.
I loaded 30 sessions spanning 20200127 through 20230622 — January 2020 to June 2023, just over three years. I sorted them by date and processed them with no cross-day alignment applied. I want to see the raw problem before any correction.
One thing I checked immediately: does the LINK release already normalize across sessions? The answer is no. The SBP values are stored as recorded. Whatever stability exists in the cross-day representation has to come from preprocessing — or doesn't exist at all.
The 30 sessions above are the fixed analysis set for this series — same recording dates, same pipeline, end to end for Parts 1–3.
What I Found
The Heatmap Tells the Story Immediately
The most direct thing I can show you is a channel × session heatmap — mean SBP for every channel, every session, all at once. Each column is a session, each row is a channel.
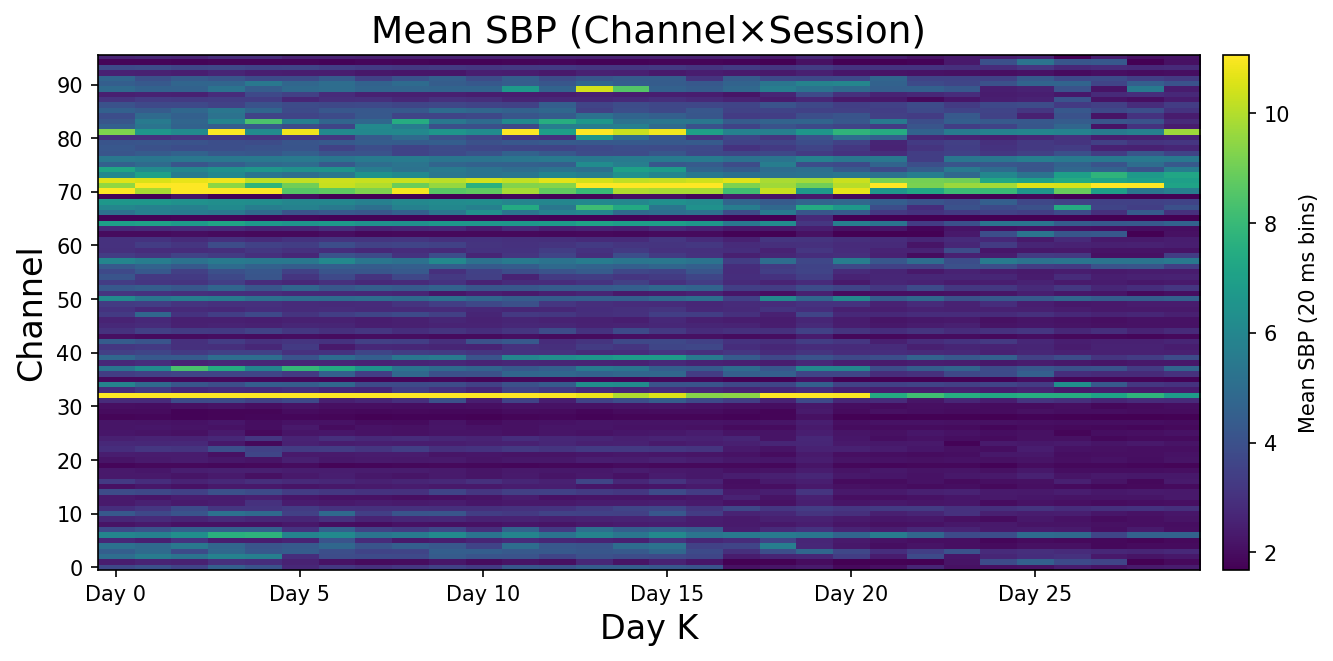
The rows have structure — each channel has a characteristic amplitude level that persists across time. The spatial fingerprint of the array is real and stable. But look at the columns. The overall brightness shifts. Some sessions are systematically hotter than others. That column-to-column variation is the drift — and no static decoder can compensate for it.
If the signal were stationary, the columns would look identical. They don't.
The Spatial Fingerprint Is Real — Which Makes the Drift Worse
Before looking at how things change over time, I want to show you what the array's amplitude profile looks like when averaged across all 30 sessions.
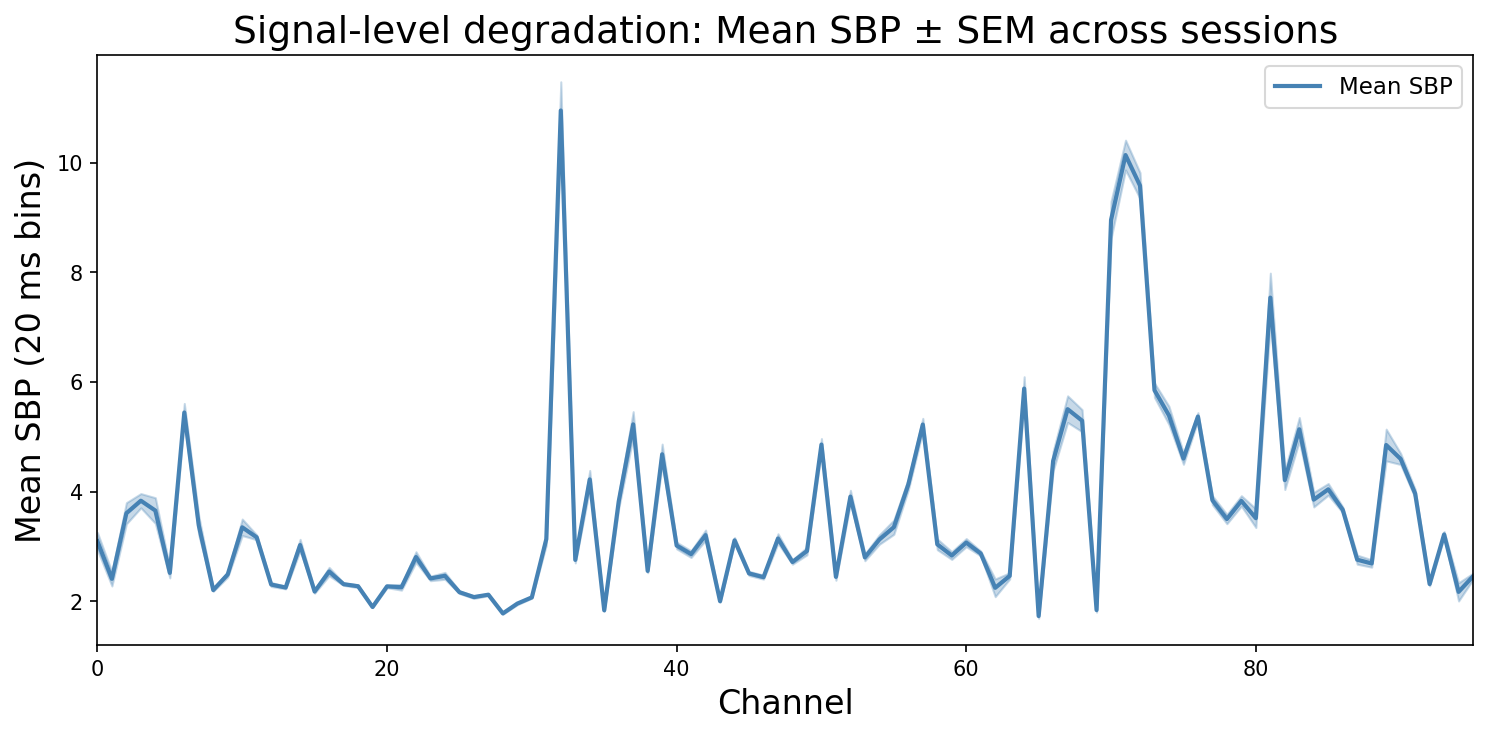
Each point is one channel. The SEM band is tight — channels maintain their relative amplitude ordering consistently across sessions. Two channels dominate: around channel 29–30 (peak ~8) and channel 70 (peak ~7.5). The spatial fingerprint of the array is real and reproducible.
This matters because it tells you what kind of drift you're dealing with. If channels were drifting randomly and independently, the SEM would be wide and noisy. It's not — the relative structure is stable. What changes, as the heatmap showed, is the overall session-level amplitude. The whole pattern shifts, and individual channels decay over years. That's a harder problem than random noise: the decoder's weights are calibrated to a specific amplitude scale, not just a relative ordering.
Each Channel Drifts Differently — That's the Hard Part
Here's where it gets worse. If every channel drifted by the same amount, you could correct it with a global offset. That's not what happens.
I plotted per-channel mean SBP on day 0 against the same values on the last session. Points on the identity line mean no drift. Points off it mean the channel moved.
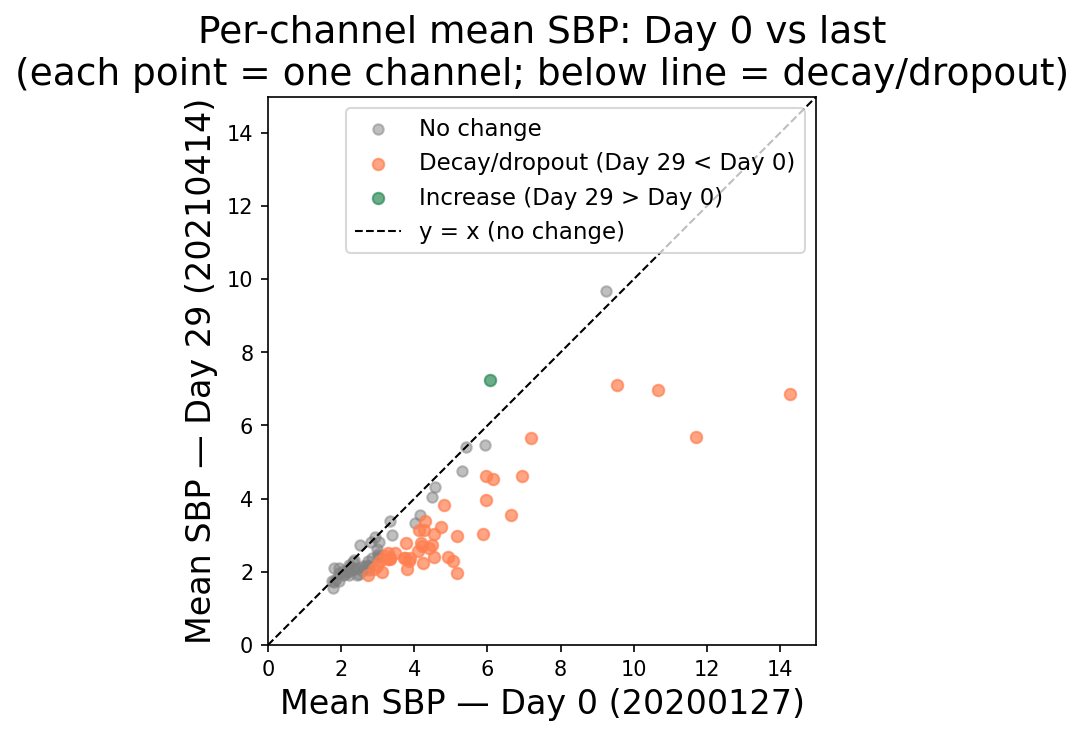
This is the scatter I expected but didn't want to see. The majority of points are orange — decay and dropout. The highest-amplitude channels on day 0 (x = 10–14) have collapsed to y = 3–4 by 2023. A few channels drifted up (green), probably just getting noisier. Almost nothing stayed put. There's no single bias correction that fixes this.
When the biggest channels on day 0 lose two-thirds of their amplitude over three years while others shift in different directions, the spatial structure the decoder learned has been fundamentally reorganized. The weights no longer point where they're supposed to.
And It Keeps Getting Worse With Time
I compared day 0 against progressively later sessions to see whether drift accumulates or plateaus.
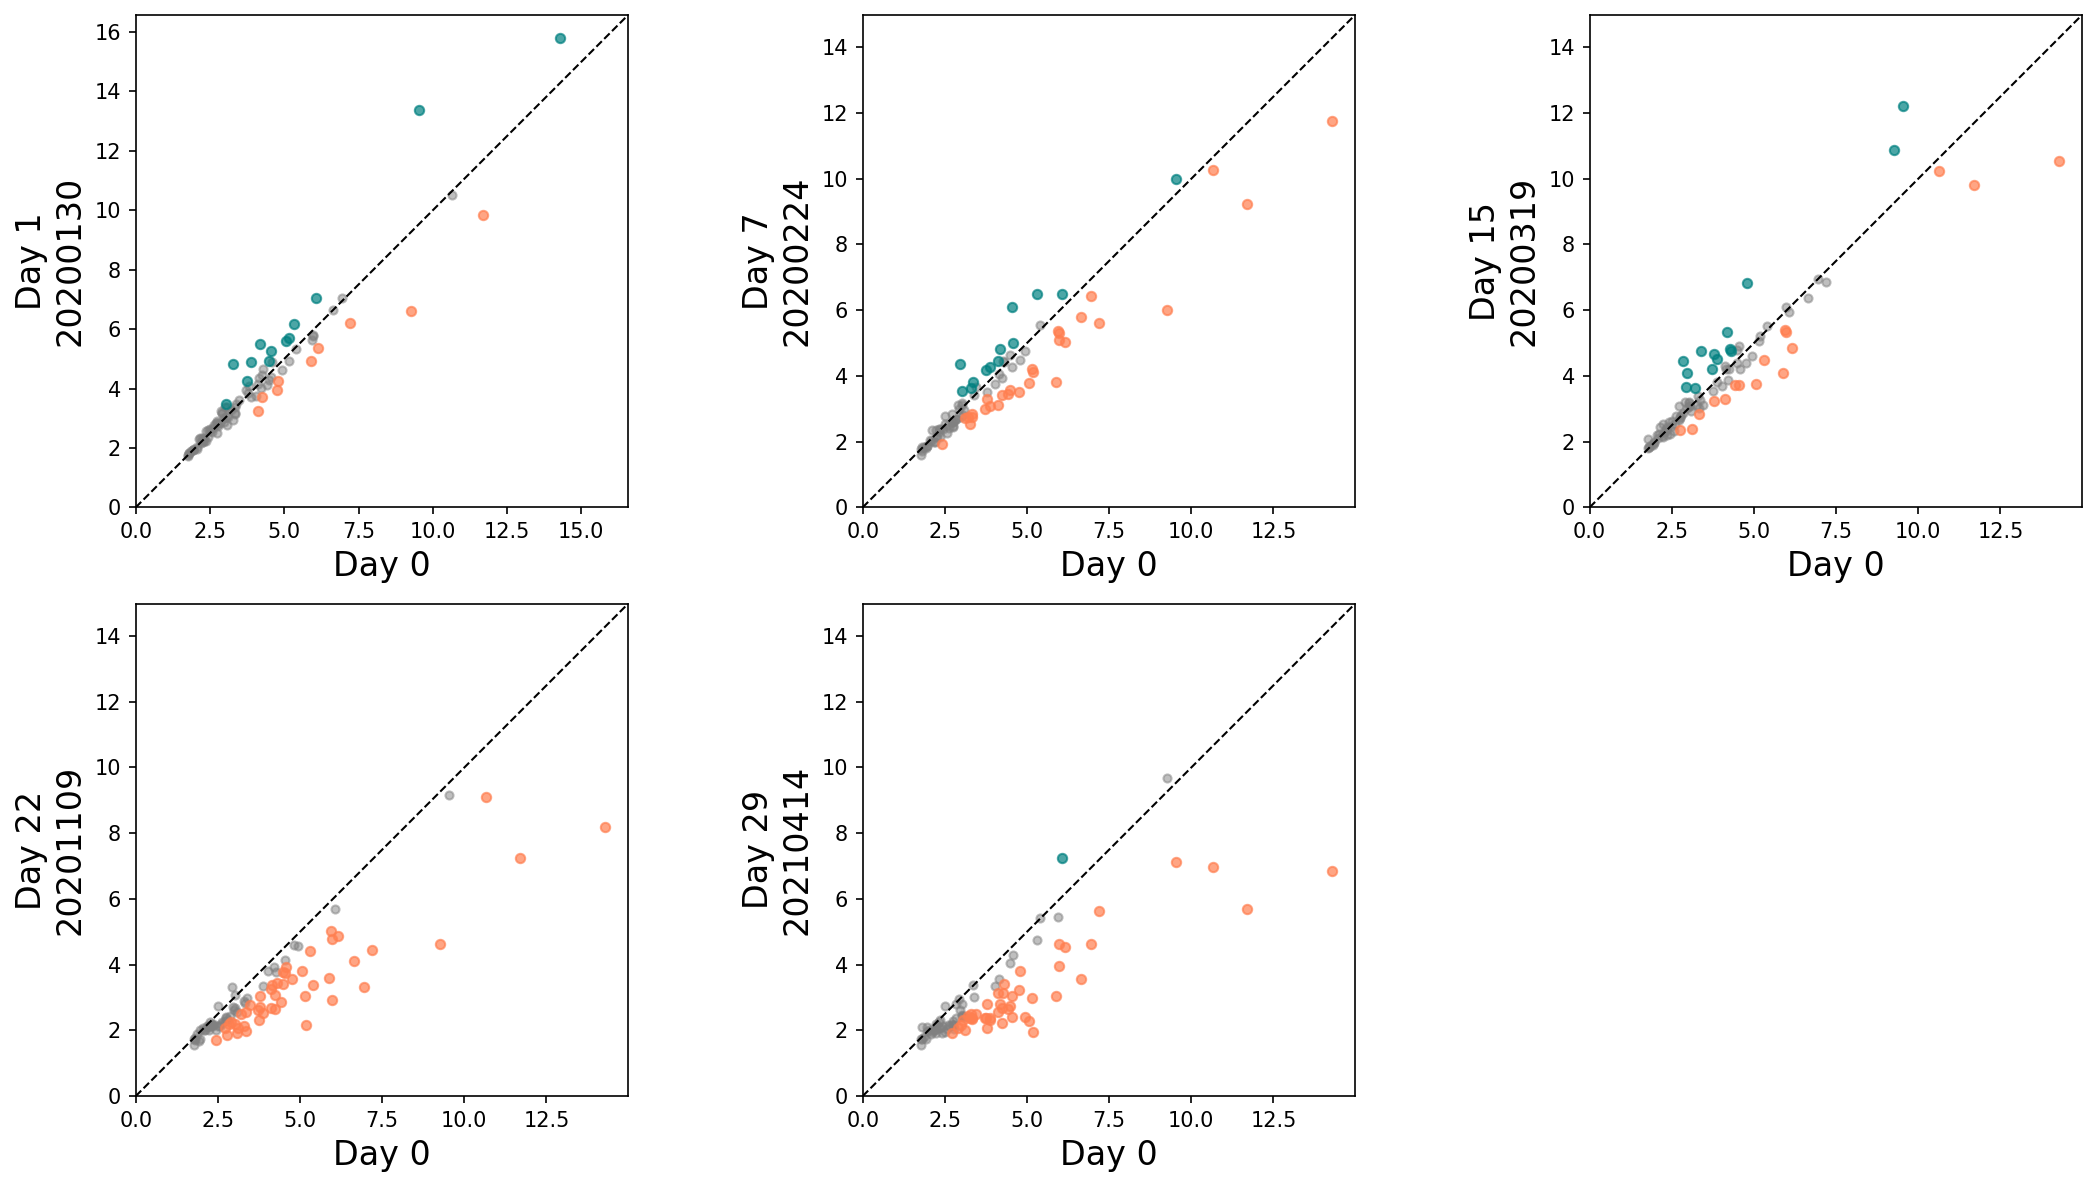
Day 1 (three days out): points scattered around the identity line, mix of orange and teal. Day 18 (~8 months): increasingly orange. Day 37 (~1.5 years): orange dominates, but one teal point shoots up to y = 20 — an electrode doing something strange. Day 55 (~2.5 years): another extreme high point again. Day 73 (3 years): matches the scatter above — orange everywhere, high-amplitude channels have collapsed. The drift doesn't plateau. It just keeps going.
The Part That Actually Matters: The Decoder Fails
Feature drift is an interesting observation. Decoder failure is a real problem. So I ran the direct test.
I trained a RidgeCV decoder on day 0 SBP and finger-velocity pairs. Then I transferred it — no retraining, no recalibration — to every subsequent session and recorded the cross-day R².
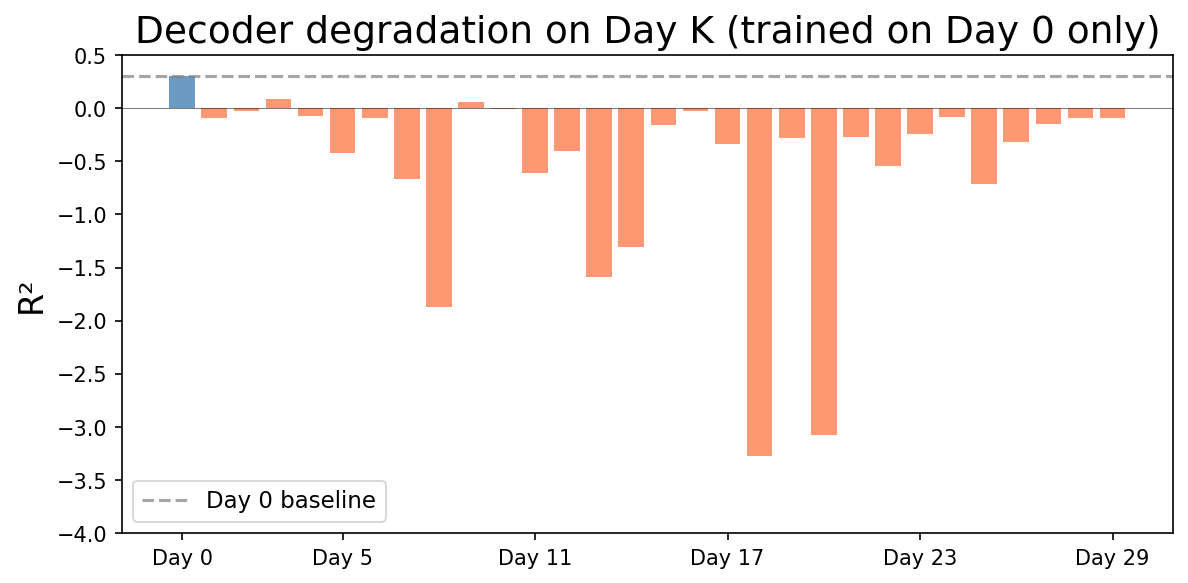
Day 0 (the blue bar): just barely positive. Every single subsequent session is an orange bar pointing down. Many are between −1 and −3. Around Day 58, one session hits nearly −10.
Before I go further — negative R² doesn't just mean "bad decoding." By construction, it means the decoder's error is higher than the no-skill baseline used in this scoring: predicting the session mean at every time step. In other words, for these days the day-0-learned mapping is not just less accurate; it's actively failing the cross-day generalization check. In extreme cases (R² around −10), the gap vs baseline is very large.
How Bad Is It Across All Session Pairs?
The day-0-fixed result shows one training scenario. I wanted the full picture: what happens when you train on any session and test on any other?
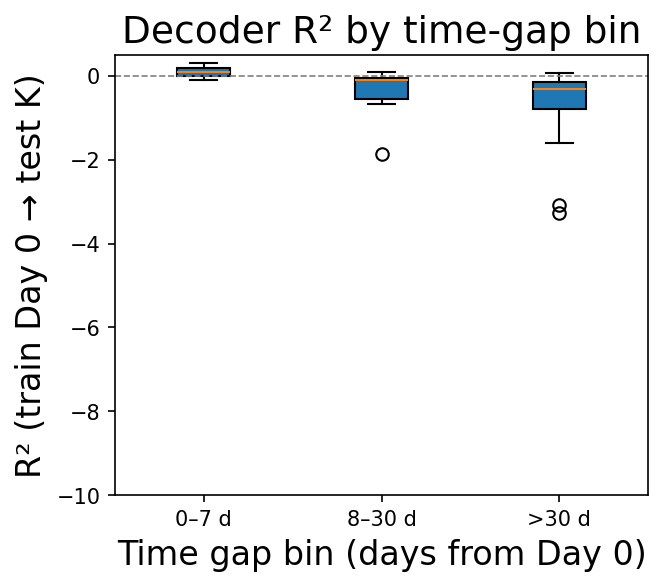
Three bins: within a week, within a month, beyond a month. The median is negative in all three. The 0–7 d bin is closest to zero — that makes sense, the signal hasn't drifted far yet. By 8–30 d, the median drops to around −0.3. Beyond 30 days, median ~−0.5 with some pairs reaching −3.5. The pattern is consistent: the further out you test, the worse the transfer.
The variance is high — some session pairs transfer reasonably. But the central tendency is clear: if you train on Day 0 raw SBP and test on a different day, you should plan to fail.
Limitations
This Part 1 intentionally applies no cross-day alignment (no recalibration), so we measure raw transfer failure. It is SBP-only, and the reported R² depends on the exact per-time-bin scoring/aggregation used in this figure. Results reflect the fixed 30-session subset described above; generalization to other sessions in the LINK release is not claimed here.
What the Data Is Telling Me
Wide table: on a narrow screen, scroll sideways to see all columns.
| What I tested | What I found |
|---|---|
| Population SBP over 3 years | Not stationary. No stable baseline, anywhere in the span. |
| Per-channel drift | Asymmetric decay. Most channels lost amplitude. The biggest ones lost the most. |
| Drift vs. time gap | Monotonically worse. No plateau. No safe window. |
| Cross-day decoder R² | Negative at every gap. Median around −0.5 beyond 30 days. One session: −10. |
Here's the thing that stays with me: the signal isn't gone. The monkey is still doing the task. The motor cortex is still firing. The information is there. The same animal, the same task, three years of data.
But the raw SBP encoding of that information has shifted so far from what the decoder learned on day one that the model is now actively working against you. Not merely degraded — the learned mapping no longer matches the shifted representation. The problem isn't the brain. The problem is that we're feeding a static model a representation that keeps changing underneath it.
This is an engineering failure, not a neuroscience one. And engineering failures have engineering solutions.
What's Next
I'm not satisfied leaving it here.
In Part 2, I introduce Gold r_norm — a per-channel, per-session z-score followed by 50 ms Gaussian smoothing. No cross-day alignment model. No labels. No recalibration sessions. It runs in milliseconds and requires nothing from the user.
That single preprocessing step shifts mean cross-day R² from −0.021 to +0.151. The negative-transfer regime — every orange bar below zero in Fig. 5, every box plot below the dashed line — disappears almost entirely.
I'll show you exactly why it works, what it doesn't fix, and where the limits are.
References
- Magland, J. F., Ly, R., Rübel, O., & Dichter, B. K. (2025). Facilitating analysis of open neurophysiology data on the DANDI Archive using large language model tools. Scientific Data, 12, 285. https://doi.org/10.1038/s41597-025-06285-x
- Rübel, O., Tritt, A., Ly, R., Dichter, B. K., Ghosh, S., Niu, L., Baker, P., Soltesz, I., Ng, L., Svoboda, K., Frank, L., & Bouchard, K. E. (2022). The Neurodata Without Borders ecosystem for neurophysiological data science. eLife, 11, e78362. https://doi.org/10.7554/eLife.78362
The repository includes the analysis notebooks, the neurosignal package and related code, and HTML exports of those notebooks.
Code: github.com/radhakrishnanrishaban/ephys-signal-atlas · neurosignal v0.1.0