The Fix Is Simpler Than You Think: Gold r_norm for Chronic SBP Drift
Part 2 of 3. Part 1 established the drift problem. This part resolves it. Part 3 introduces the nonlinear cross-session decoder.
Part 1 ended with a sharp claim: the decoder failure I showed isn't a neuroscience problem, it's an engineering one. If the representation going into the decoder keeps shifting underneath it, the decoder can't be expected to hold. Fix the representation, and the decoder should recover.
That's what this part tests.
The Fix
Gold r_norm is a two-step preprocessing operation applied within each session, independently:
- Per-channel z-score: For every channel
iin sessiond, subtract the session mean and divide by the session standard deviation at every time bint:
where and are computed over all time bins in session .
- 50 ms Gaussian smoothing: Apply a Gaussian kernel (σ = 2.5 bins × 20 ms/bin = 50 ms) along the time axis:
Nothing crosses session boundaries. No alignment model. No labelled recalibration data. The entire operation uses only the statistics of the current session.
Implementation: drift.py:normalize_sessions_sbp_gold()
Why This Should Work
The drift fingerprint in Part 1 was specific: the columns of the channel × session heatmap shifted — whole-session amplitude went up and down over time. The rows were stable — relative channel ordering persisted across years.
That asymmetry points directly at the fix. The problem is session-level amplitude and variance mismatch, not the loss of spatial structure. A per-session z-score removes exactly that: it recenters each session to zero mean and rescales to unit variance, per channel, before the decoder ever sees the data.
Gaussian smoothing adds a second correction. Linear decoders for finger velocity need the temporal correlation structure of the signal to be intact. Raw z-scored SBP can have high-frequency bin-to-bin noise that makes decoding harder even when the amplitude is correct. The 50 ms smoothing suppresses that without erasing the movement-relevant modulations.
The pairwise matrices below make the effect concrete: session-level amplitude mismatch shows up as cold off-diagonal mass under raw SBP, and Gold r_norm restores broadly positive transfer without any cross-day alignment.
The Direct Test
The clearest test mirrors the failure in Part 1 exactly: train a RidgeCV decoder on Day 0, freeze the weights, and test on every subsequent session. Part 1 showed every bar pointing orange and downward. Under Gold r_norm, that same Day-0-fixed setup stops collapsing: transfer stays at or above zero across the three-year span instead of diving toward the extreme negatives raw SBP hit in Part 1. The full (train, test) picture is in the pairwise heatmaps — not just Day 0 as trainer.
The Full Pairwise Picture
Day-0-fixed is one training scenario. The complete test is all (train, test) pairs — what happens when you train on any session and evaluate on any other?
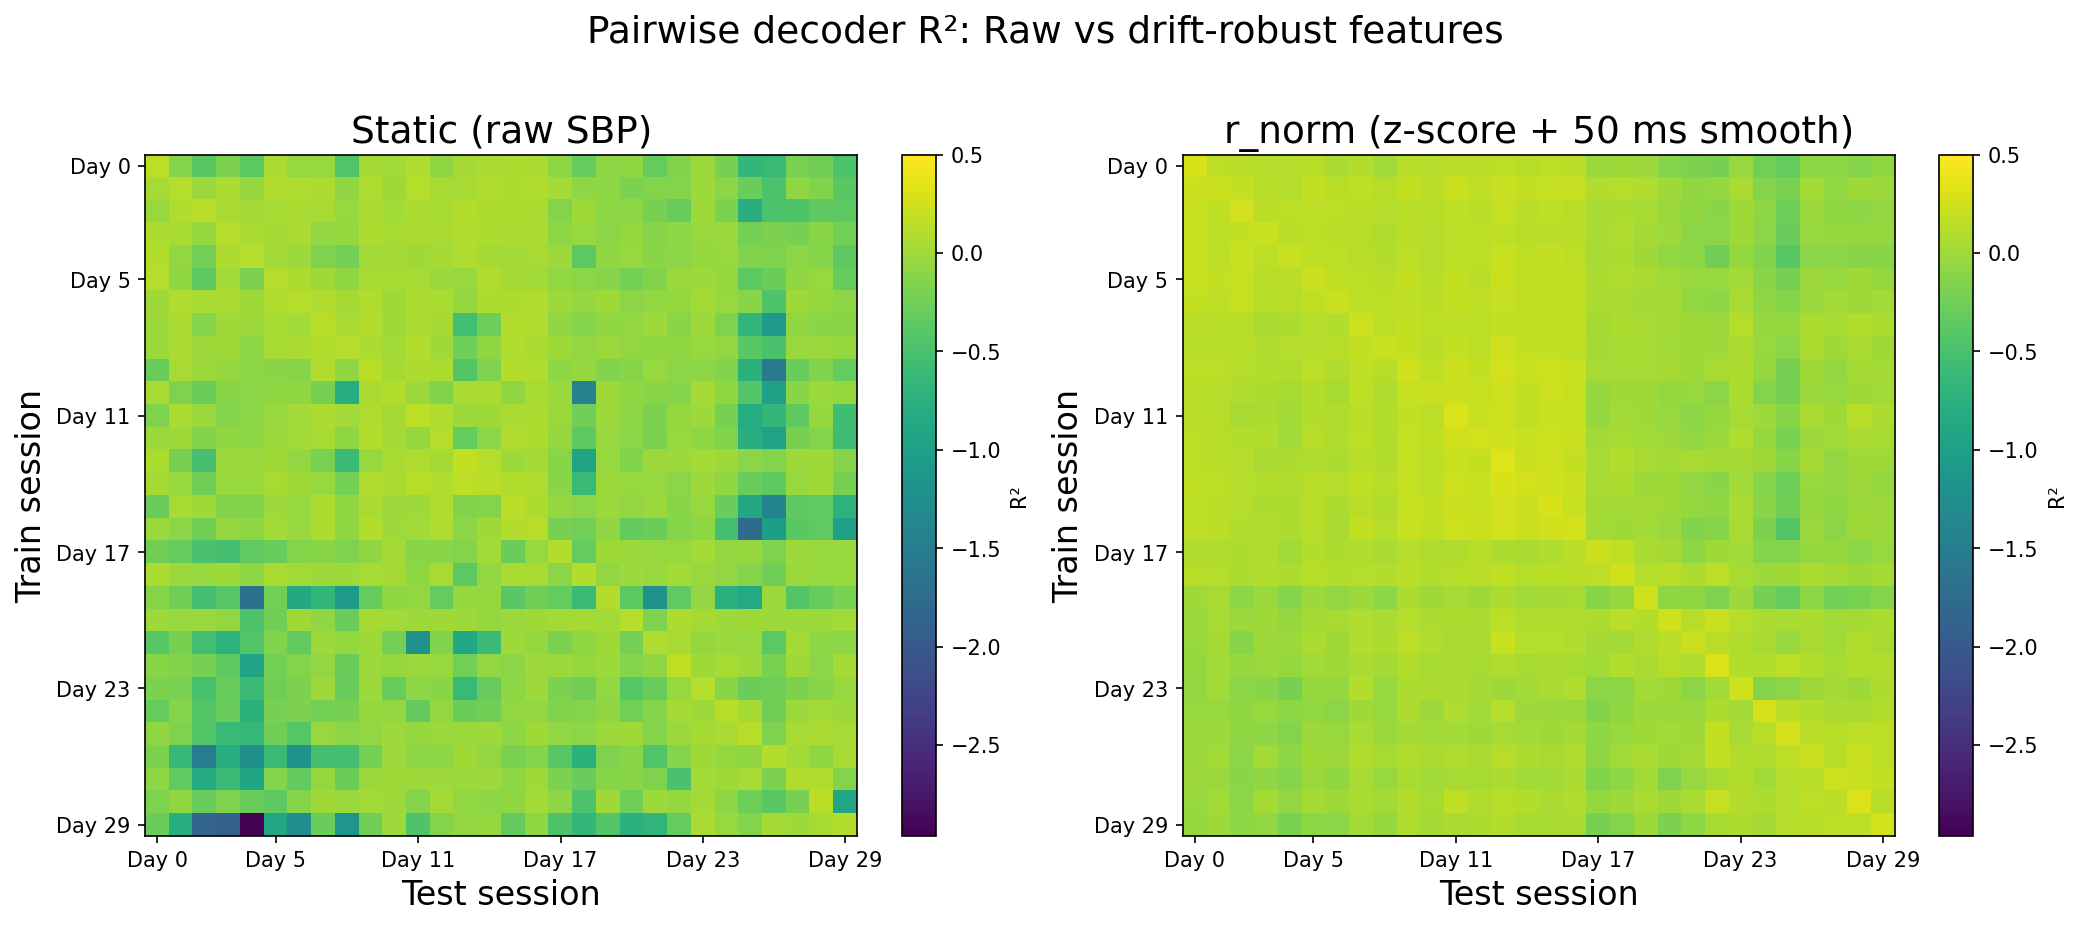
Under raw SBP, the matrix is warm only near the diagonal — pairs separated in time fail. Off-diagonal entries are cold and mostly negative. Under Gold r_norm, the off-diagonal region becomes broadly positive. The train-test gap no longer reliably predicts failure.
The summary:
Wide table: on a narrow screen, scroll sideways to see all columns.
| Condition | Mean off-diagonal R² |
|---|---|
| Raw SBP | −0.021 |
| Gold r_norm | +0.151 |
The improvement is +0.17. The more important point is what happens to the distribution: the negative-transfer regime that made the decoder actively harmful in Part 1 disappears almost entirely.
Ablation: What's Doing the Work?
Two-step methods invite the obvious question: which step matters?
Wide table: on a narrow screen, scroll sideways to see all columns.
| Feature | Mean off-diagonal R² |
|---|---|
| Raw SBP | −0.021 |
| Z-score only | +0.065 |
| Gold r_norm (z-score + smoothing) | +0.151 |
The z-score alone recovers roughly 40% of raw SBP's negative baseline just by removing session-level amplitude shifts. Adding the Gaussian smoothing doubles the gain. Both steps are doing real work.
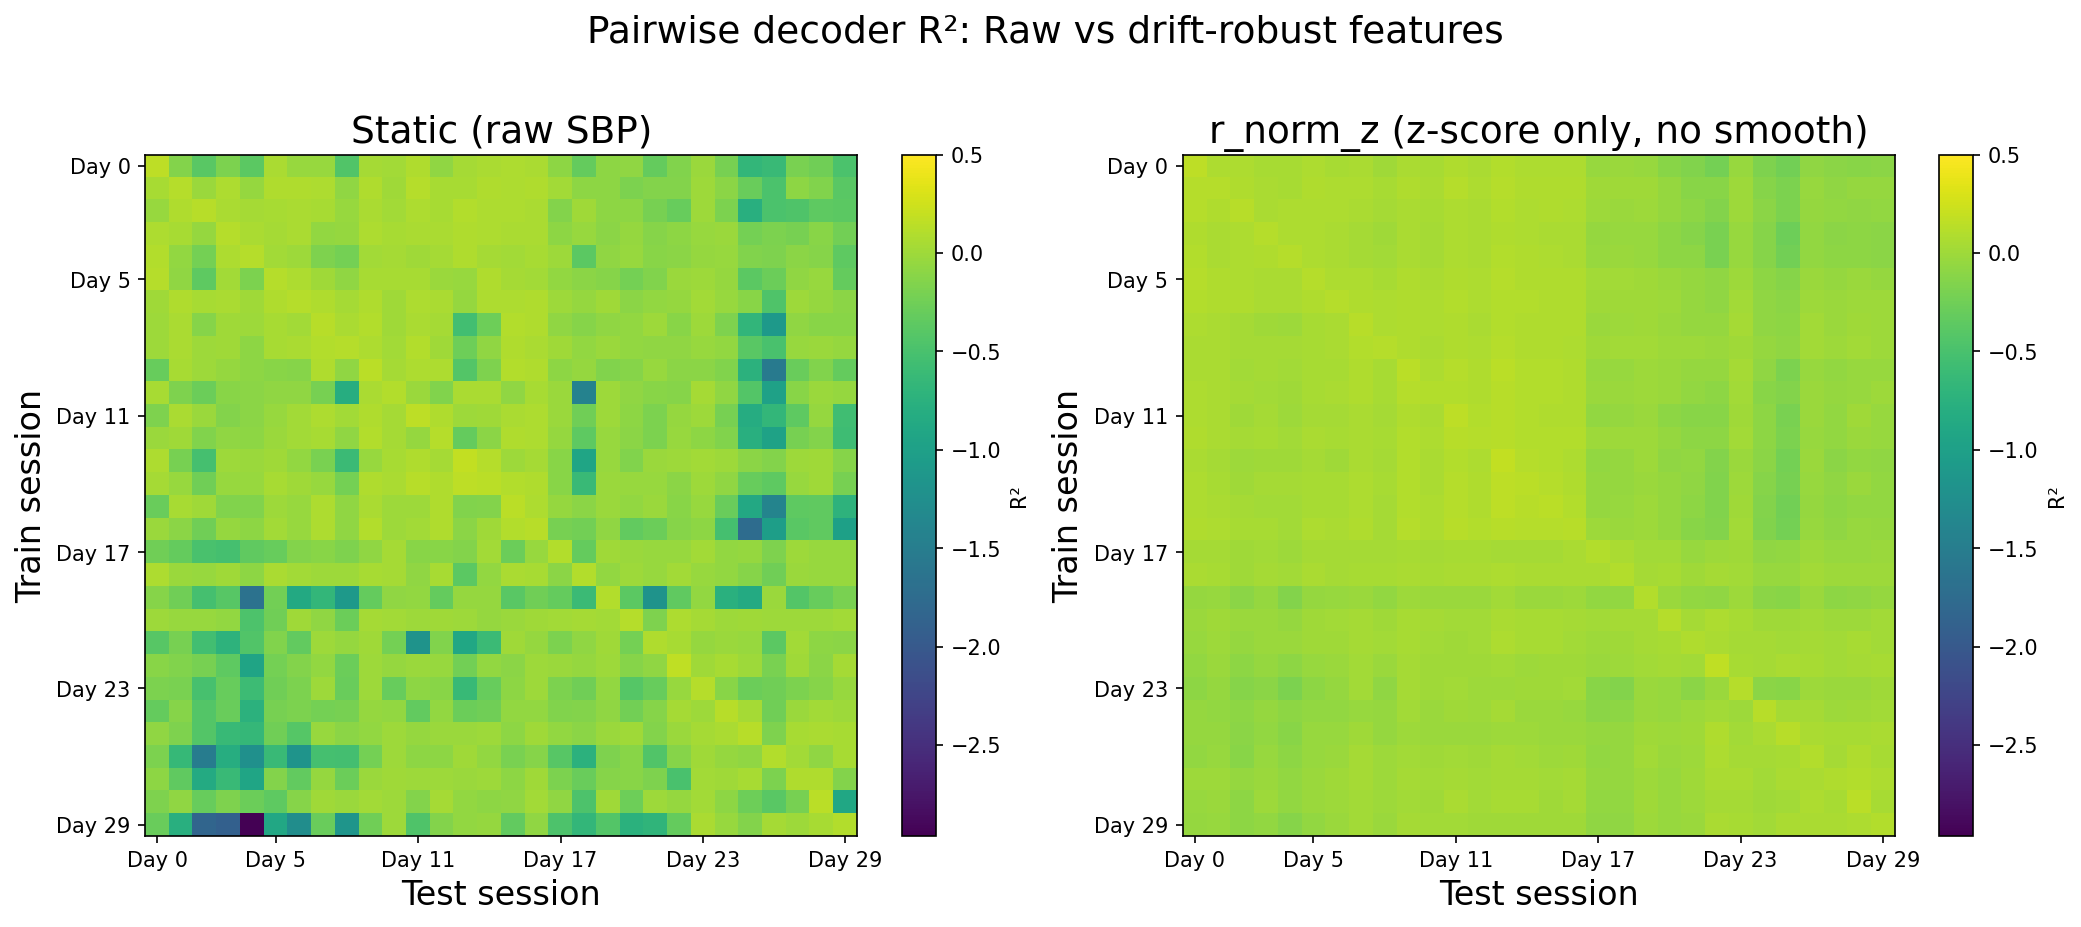
Z-score only removes the amplitude mismatch but still leaves noisier off-diagonal blocks. The full Gold r_norm pipeline — with smoothing — closes most of that remaining gap.
Does the Gain Hold Across Time?
A correction that only helps on short train-test gaps isn't solving the chronic problem. Part 1 showed raw SBP median transfer sliding negative as the train–test gap widens; under Gold r_norm the pairwise picture stays positive well beyond one month, so the gain is not a short-gap artifact. The horizon table below summarizes the same story at the level of binned gaps.
The horizon summary confirms this at the level of individual session pairs:
Wide table: on a narrow screen, scroll sideways to see all columns.
| Feature set | Intra-day R² | 1–7 days | 1 month+ |
|---|---|---|---|
| Gold r_norm (96-ch) | 0.268 | 0.117 | 0.118 |
| Raw mean (1-ch population) | 0.001 | −0.001 | −0.002 |
The 96-channel Gold representation stays informative at every horizon. Collapsing to a one-dimensional population mean throws away the spatial structure and yields nothing useful — confirming that the per-channel spatial fingerprint (stable across years, as Part 1 showed) is carrying the decoding signal.
Qualitative Check: Do the Traces Still Make Sense?
Better R² is necessary but not sufficient — if the improved decoder is predicting noise that happens to correlate with velocity by accident, it won't look right. The decoded traces provide the intuition check.
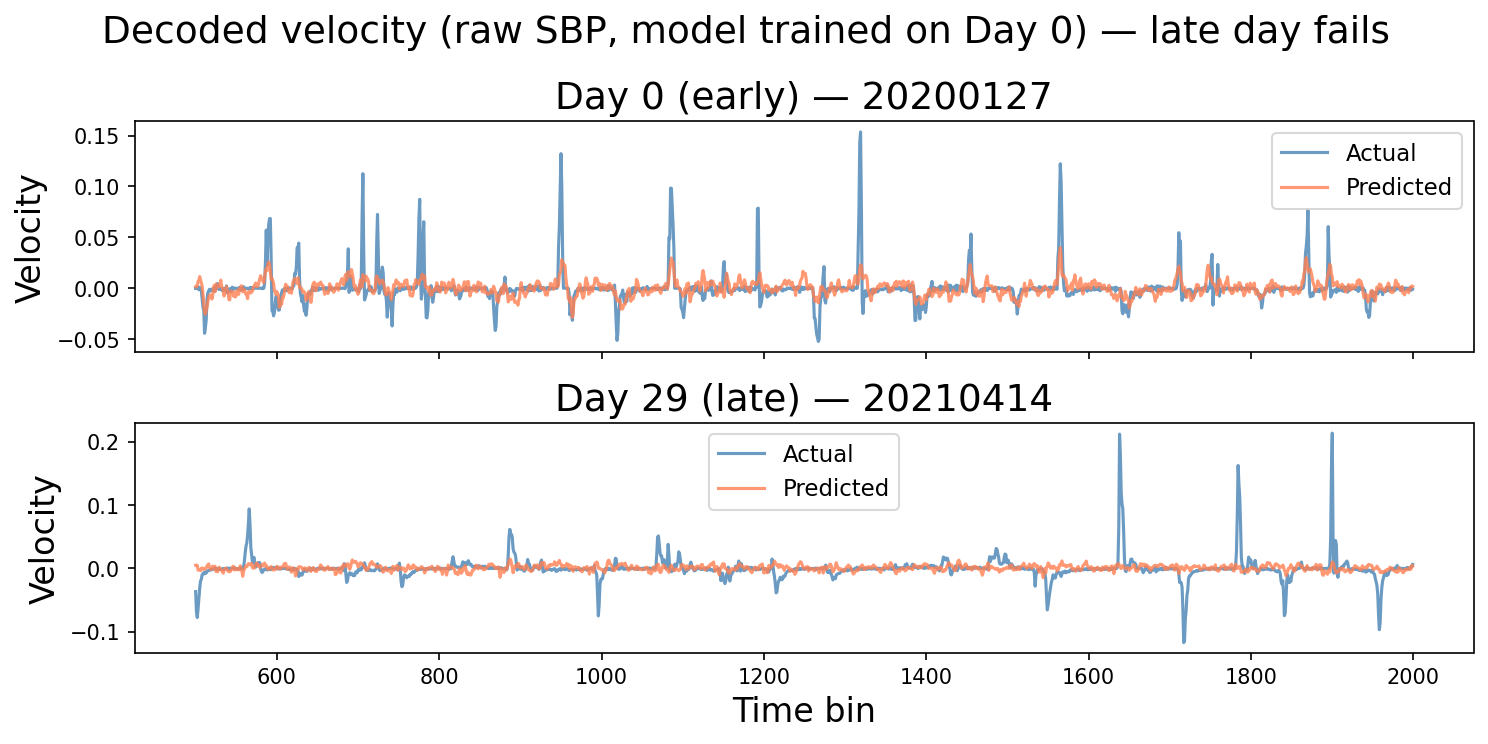
Under raw SBP, the late-session decoder loses movement structure once the feature distribution has shifted — the trace flattens toward a poor constant guess.
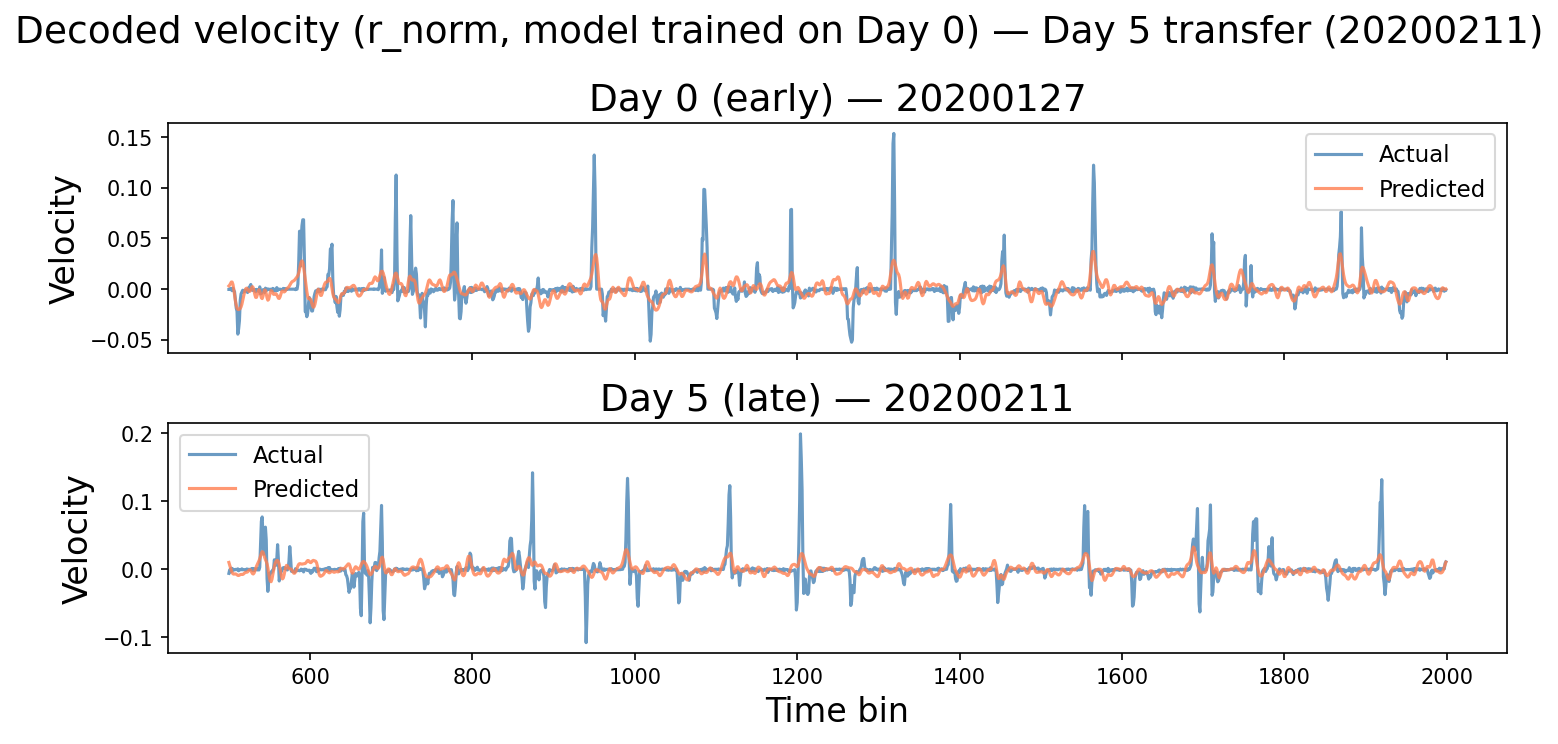
Under Gold r_norm, the late-session prediction tracks true velocity with visible sign and timing agreement. The improvement in R² corresponds to something behaviorally real.
Limits
Gold r_norm is a preprocessing step, not a general solution. The scope of what it solves is specific:
- SBP only. TCR (threshold-crossing rates) drift over the same multi-year span and wasn't tested here. The same z-score logic may apply, but that's a separate analysis.
- Session-internal statistics only. The z-score uses the mean and std of the current session. This assumes the session's internal statistics are informative — which is true for recordings with sufficient task-modulated activity. Quiet or severely degraded sessions may have uninformative baselines.
- Linear decoder, full session. R² was computed using RidgeCV trained on the full session and tested on the full session of another day. Real-time use requires a calibration window and would see different numbers.
- Fixed session set. The same 30 sessions as Part 1; how Gold r_norm behaves on held-out or lower-quality days is not characterized here.
- NHP data. The LINK dataset is non-human primate motor cortex with a Utah array. Human implants may have different drift profiles, different electrode geometries, and different task structure.
What's Next
The fix confirmed here is a per-session operation on SBP. The next question is whether a nonlinear decoder trained once across all sessions — using both SBP r_norm and TCR z_norm — can push cross-session performance further, including at gaps beyond a month where the Ridge baseline still struggles.
Part 3 answers that: a single MLP trained jointly on all 30 sessions maintains R² above 0.34 across every transfer horizon, including pairs separated by a year or more.
References
- Magland, J. F., Ly, R., Rübel, O., & Dichter, B. K. (2025). Facilitating analysis of open neurophysiology data on the DANDI Archive using large language model tools. Scientific Data, 12, 285. https://doi.org/10.1038/s41597-025-06285-x
- Rübel, O., Tritt, A., Ly, R., Dichter, B. K., Ghosh, S., Niu, L., Baker, P., Soltesz, I., Ng, L., Svoboda, K., Frank, L., & Bouchard, K. E. (2022). The Neurodata Without Borders ecosystem for neurophysiological data science. eLife, 11, e78362. https://doi.org/10.7554/eLife.78362
The repository includes the analysis notebooks, the neurosignal package and related code, and HTML exports of those notebooks.
Code: github.com/radhakrishnanrishaban/ephys-signal-atlas · neurosignal v0.1.0